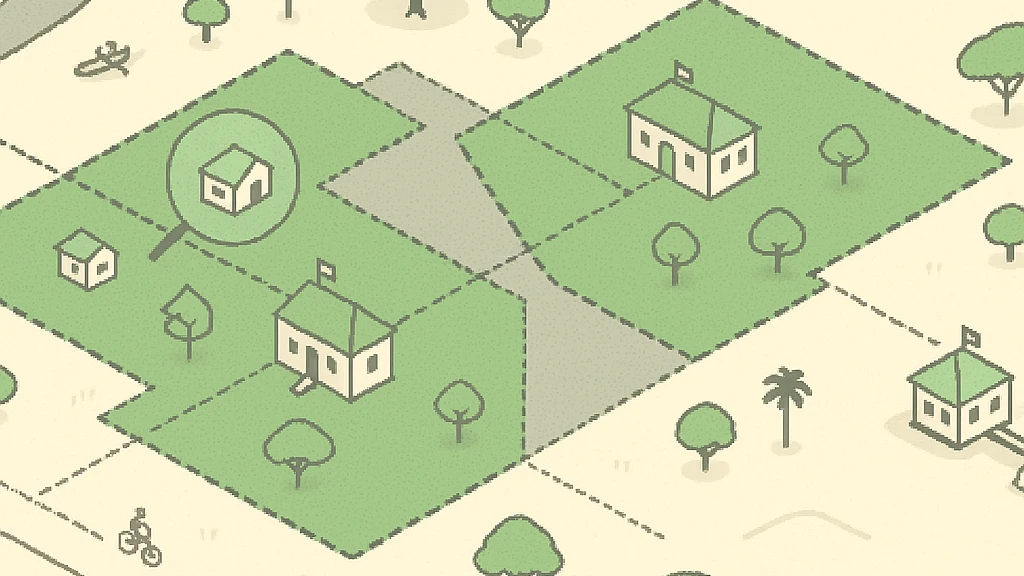
Reading the flood overlay: what it shows and what it doesn’t

The flood layer on our flood map draws Gold Coast Council's planning-scheme flood mapping over the actual buildings of the coast, so instead of a blue blob on a street grid you can see which buildings a mapped area touches. That makes it easier to read — and easier to over-read. This post is about the difference.
What the overlay shows
The Flood Hazard Overlay is part of City of Gold Coast's planning scheme. It maps the areas Council has identified as subject to flood hazard for planning purposes: inside those areas, the planning scheme applies extra rules to development — things like floor levels, building work and how land can be used. It is the product of Council's flood studies and modelling, translated into a boundary that the planning system can act on.
In other words, the overlay answers a specific question: which land does the planning scheme treat as flood-prone? That is genuinely useful — it is the same mapping that shapes what can be built and where.
What it does not show
- It is not a live flood warning. The overlay does not know whether it is raining, what the creeks are doing, or whether a road is cut right now. For warnings and current conditions, use the Bureau of Meteorology and Council's official disaster channels — never a planning map.
- It is not a prediction of any particular flood. A mapped area does not mean water reached there in some past event, or will in the next one. Planning mapping is deliberately conservative in places, and real floods do not read planning schemes.
- It is not the whole picture for a property. Planning-scheme mapping works at the scale of land, not individual floor levels. Whether a specific house is at risk depends on details no overlay can carry.
Where the data comes from
The overlay boundaries we draw come from City of Gold Coast's open data, which publishes the planning scheme's mapping layers. We render them over building footprints from OpenStreetMap (© OpenStreetMap contributors). Council's own published mapping remains the authoritative version — if a decision hangs on it, check the source, not a redrawing of it.
How to actually use it
Treat the overlay as a first look, not a verdict. It is good at exactly one job: showing you, building by building, where planning-scheme flood mapping applies, so you know whether the question is even worth asking for an address you care about. If it is — you are buying, renting low-set near a creek, or planning to build — go to the primary sources: City of Gold Coast's flood mapping and property information, and professional advice for anything structural or financial.